Our first post surveyed the architectural landscape—what exists, what it promises, and where the open questions lie. Now we move into the workshop. Benchmarking general-purpose LLMs against domain-specific specialists requires more than models; it requires the right testing environment: curated datasets, a repeatable ETL pipeline, and feature engineering calibrated to the temporal rhythms of financial data. Here we detail the data infrastructure and design decisions behind it.
The Data Strategy
To represent the complexities of the funding domain, we curated diverse datasets covering macro indicators, firm-level risk, and demand forecasting. Finding the data was only the first step; to make it usable for a rigorous comparison between general-purpose and specialized models, we built a robust Extract, Transform, Load (ETL) pipeline.
We organized our datasets into two primary tracks to reflect the distinct requirements of financial analysis:
The Tabular Track (Classification & Regression)
Funding decisions are built on rows and columns—balance sheets, credit scores, and application statuses.
- Lending Club & Prosper Loan: These gold-standard classification datasets use institutional data dense with features like debt-to-income ratios to predict loan default risk.
- Home Credit Default Risk: This high-dimensional regression dataset (491 features) predicts the total credit amount from application features and aggregated bureau, previous application, POS, credit card, and installment payment histories.
- Give Me Some Credit & Credit Card Fraud: These tasks focus on predicting delinquency and detecting minute fraudulent patterns.
- Loan Approval & Default: These datasets help evaluate the likelihood of application success or potential failure, providing a robust test for a model's ability to classify financial risk.
- Public Use Database (PUBD): This regression task predicts mortgage note rate percentages, a core activity for secondary market acquisitions.
- Econ Incentives: This regression task predicts disbursement amounts for NY State economic development incentives, capturing funding and job creation metrics across public projects.
The Time-Series Track (Temporal Dynamics)
Financial health is inherently temporal; a business's value is determined by its trajectory rather than a static snapshot.
- World Development Indicators (WDI): This high-dimensional challenge uses over 450 features to forecast GDP growth, serving as a primary macro-funding indicator.
- Walmart Sales & MTA Daily Ridership: These forecasting tasks test a model's ability to handle seasonal cycles and noise in temporal data.
Prioritizing Domain Relevance: Our Dataset Rubric
Since our curated collection includes datasets with varying degrees of proximity to the financial core, we developed a Domain Fit Rubric (DFR) to act as a precision filter for our results. This approach ensures that a model's success on high-stakes institutional data carries more weight than its performance on general trend datasets. We grade each dataset on a scale of 1 to 3 across five critical dimensions outlined below.
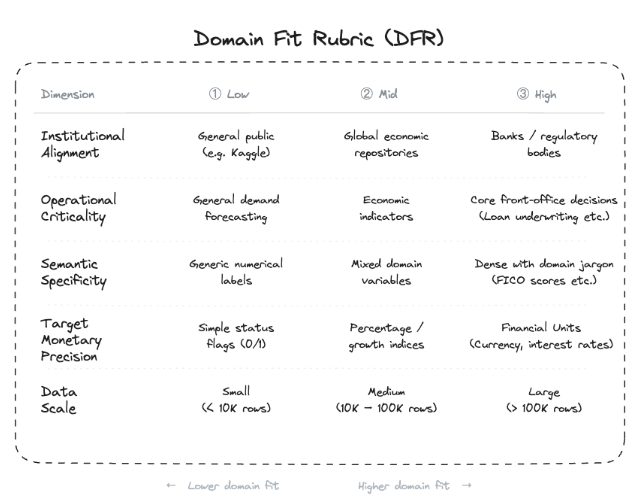
This systematic scoring allows us to calculate a Domain Fit Score for every entry in our library. By doing so, we can place maximum priority on high-fit institutional sets like Home Credit Default Risk and Lending Club while using sets like MTA Daily Ridership as essential benchmarks for measuring a model's general forecasting flexibility.
From Raw to Ready: The ETL Pipeline
Real-world financial data is often messy and inconsistent. We standardized our approach by building a reproducible pipeline that handles everything from initial cleaning to model-specific formatting.
- Sourcing & Standardization: We pulled datasets from sources including Kaggle, government portals, and the World Bank. Each uses a dedicated script to standardize column names, handle missing values, and create consistent splits to ensure every model is evaluated on exactly the same unseen data.
- Format Adaptation: Different models require distinct data structures to operate effectively. Our pipeline converts tabular rows into semantic JSONL formats for LLMs to create structured narratives. Simultaneously, we implement specialized converters to reshape data into long-form structures required by time-series forecasting frameworks.
Feature Engineering for Temporal Dynamics
Because models must grasp the trajectory of financial health, we engineered specific features to support our time-series track:
- Lag Features: We added lag periods for 1, 7, 14, and 28 days to provide models with immediate historical context.
- Rolling Statistics: We calculated rolling means and standard deviations to highlight trends and volatility.
- Cyclical Date Encoding: To represent recurring patterns, we transformed dates using sine and cosine encoding to capture seasonality.
Next Step: Connecting the Dots
Now that we've outlined our data ecosystem, the next step is rigorous benchmarking. In our upcoming post, we'll walk you through our model selection criteria, explaining exactly which architectures we chose and why. Crucially, we'll describe how we engineered a level playing field to ensure objective comparisons, spotlighting the specific strengths and weaknesses of each approach.
A central focus of our analysis will be the 'Math Problem.' Standard language models often struggle with arithmetic because they process numbers as fragmented text tokens—breaking them into meaningless components—rather than as distinct numerical values. This fragmentation disrupts the model's ability to grasp mathematical magnitude, a capability essential for accurate ledger interpretation. We will examine our Metric Leaderboard to determine if specialized numerical encoders can solve this problem where general-purpose LLMs falter, and whether that theoretical advantage translates into higher performance on real funding data.
Ultimately, this benchmarking effort allows us to answer a pivotal question: Is the investment in specialized architectures truly worth it? By the end, we'll bring together insights that connect experimental results, leaderboard dynamics, and cost-benefit considerations to determine the best path forward for the funding domain.