Our first two installments took us through the theoretical landscape and into the gritty details of the data strategy. Now, we are moving from preparation to execution as we put our curated environment to the test to see which models actually outperform in the field.
In this post, we are revealing the outcomes of our benchmark-a head-to-head comparison between general-purpose and cross-domain methodological models. Our goal is to go beyond a simple list of performance metrics to evaluate the Return on Investment (ROI) of technical complexity.
We wanted to answer a fundamental question: Does the extra effort of domain-specific foundation models actually yield superior performance in the funding domain, or can a General-Purpose model reach the same efficiency frontier?
Model Evaluation Setup
One of the core challenges of evaluating Domain-Specific Foundation Models (DSFMs) is ensuring the comparison is not apples-to-oranges. While a general-purpose model like GPT-4o-mini is a world-class polymath, its architecture was optimized for general language processing rather than the rigid, grid-based logic of a financial spreadsheet. To make the test fair and comparable, we ran three architectural families-defined in our initial survey-through a common evaluation framework.
The Three Contenders
Before diving into the scores, it is essential to remember the distinct philosophies of the models we selected for this arena:
- General-Purpose Models: We chose GPT-4o-mini to represent the broad foundations. These models rely on semantic reasoning and vast world knowledge but often lack deep, native expertise in structured financial data.
- Tabular Foundation Models: For our tabular specialist, we chose TabPFN. This cross-domain methodological model is built specifically for rows and columns, using symbolic processing and dual-attention mechanisms to maintain critical relationships between features.
- Time-Series Foundation Models: We selected Google's TimesFM to focus on the trajectory of data. It is designed to bridge the gap between numerical sequence modeling and strategic financial reasoning, handling the seasonal cycles and volatility inherent in funding transactions.
The Testing Tiers
Our experimental design tests the limits of these different architectures, comparing them across five distinct categories:
- Tabular Foundation Models: Evaluating off-the-shelf performance of models like TabPFN, which were identified in our initial survey as a cross-domain methodological model.
- Time-Series Foundation Models: Testing models like TimesFM that bridge the gap between numerical sequence modeling and financial reasoning.
- General-Purpose Models: Testing the zero-shot performance of GPT-4o-mini.
- Fine-tuned General-Purpose Models (The Vertical Adaption): Pushing the general-purpose models further through dataset-specific training to measure how much they can bridge the domain gap and evolve into a functional Vertical DSFM.
- Standard Machine Learning (XGBoost): Including a traditional, high-performance baseline to ensure how our foundation models actually perform against legacy methods.
Scoring Methodology
While our curated datasets range from institutional ledgers to transit ridership, not all performances carry equal weight due to their varying applicability to the funding domain. Correctly identifying a high-risk borrower on a bank's ledger represents a different tier of institutional intelligence than forecasting demand for a retail chain. To reflect this, we weighted the performance metrics across various datasets based on our Domain Fit Rubric (DFR), which can be found in Table 1.
Why Some Scores Count More
As a reminder, our rubric grades datasets across five dimensions: Institutional Alignment, Operational Criticality, Semantic Specificity, Monetary Precision, and Data Scale. This systematic scoring allows us to place maximum priority on "Gold Standard" institutional sets like Home Credit Default Risk and Lending Club while using sets like MTA Ridership as essential benchmarks for measuring a model's general forecasting flexibility.
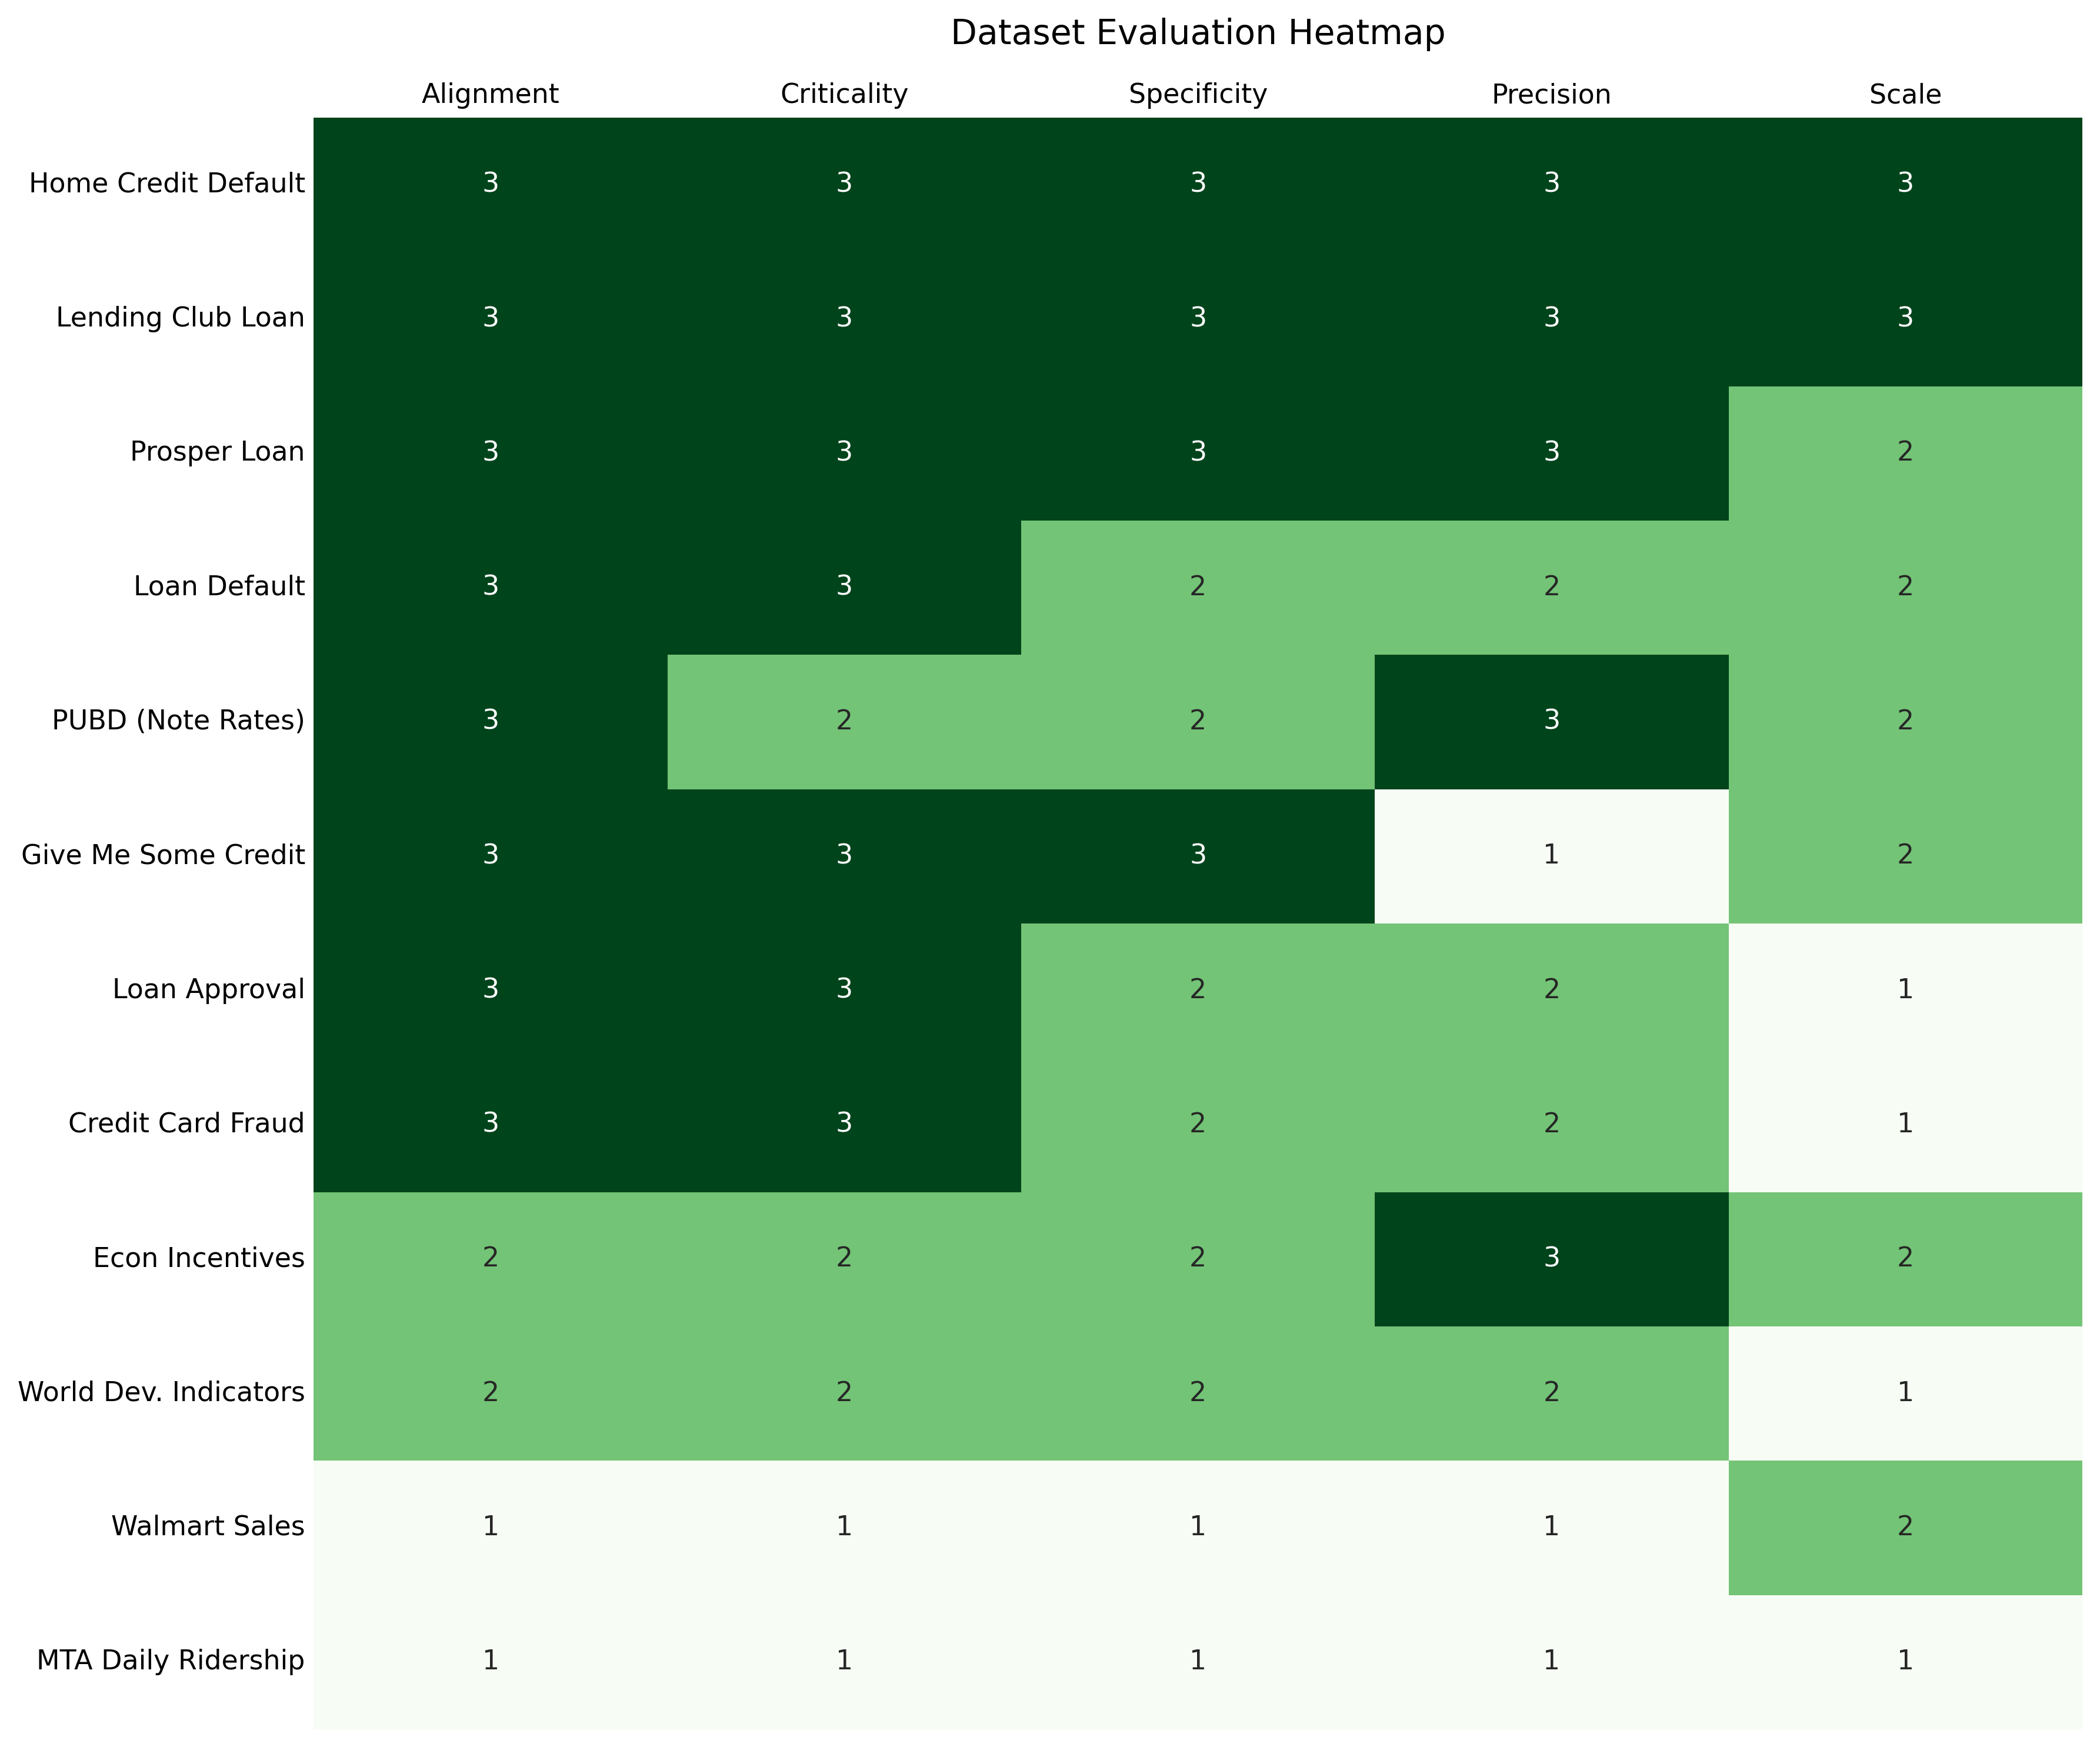
Table 1: Rubric scores and weights of the datasets
Benchmark Results
We have separated the results into two distinct scoreboards to reflect the two core ways funding agents process data: Classification (Yes/No decisions) and Regression (Predicting exact amounts or interest rates).
We can now look at the scoreboards. To set the stage for our results, it is important to understand how we actually kept score. We did not just pick a single number; we built a multi-layered evaluation engine designed to reflect the true "win" in a financial context.
Scoring Engine
Before we look at the leaderboard, here is a quick breakdown of how we moved from raw predictions to a final "Weighted Score":
- Per-Dataset Metrics: For classification tasks, we focus on the F1 Score (using weighted averaging for multiclass tasks) to balance precision and recall. For regression tasks, we compute the Root Mean Square Error (RMSE) and then normalize it to a 0-1 scale within each dataset based on the performance of all evaluated models: the model with the lowest RMSE (best performance) receives a score of 1.0, while the model with the highest RMSE (worst performance) receives 0.0, with other models scaled proportionally in between.
- Rank-Based Normalization: To make different datasets comparable, we convert performance into a normalized score between 0 and 1. The best-performing model on a specific dataset gets a 1.0, while the worst gets a 0.0. This ensures that a model is not unfairly rewarded just for performing well on an "easy" dataset.
- The Final Weighted Score: This is where our Domain Fit Rubric (DFR) comes in. We calculate the final leaderboard position by taking a weighted average of these normalized scores. Each dataset's weight is determined by its institutional alignment, criticality, specificity, precision, and scale.
By using this approach, we ensure that a model's "gold medal" on a high-stakes dataset like interest rate prediction counts significantly more than a win on a general dataset like daily ridership estimation.
Classification Leaderboard
The Classification Track tests a model's ability to draw hard lines-default or not, fraudulent or legitimate-by synthesizing complex features like debt-to-income ratios and credit histories. Success in this track requires the model to accurately categorize risk based on the structured relationships found within institutional ledgers.
To determine the true winner, we weighted the results using our Domain Fit Rubric (DFR). This ensures that a model's performance on a 100,000-row institutional bank ledger like Lending Club counts more than its performance on smaller or less critical datasets.
Note on Model Selection: It is important to note that while TimesFM was a core contender in our setup, it was excluded from this track. Time-Series Foundation Models are specialized for sequential numerical forecasting, and because our evaluation framework did not include a time-series dataset requiring categorical classification, we focused our testing on the Regression Track.
| Model Name | Weighted Benchmark Score (WBS) |
|---|---|
| TabPFN | 0.819 |
| GPT-4o-mini fine-tuned | 0.806 |
| XGBoost | 0.803 |
| GPT-4o-mini | 0.724 |
Table 2: Overall classification results.
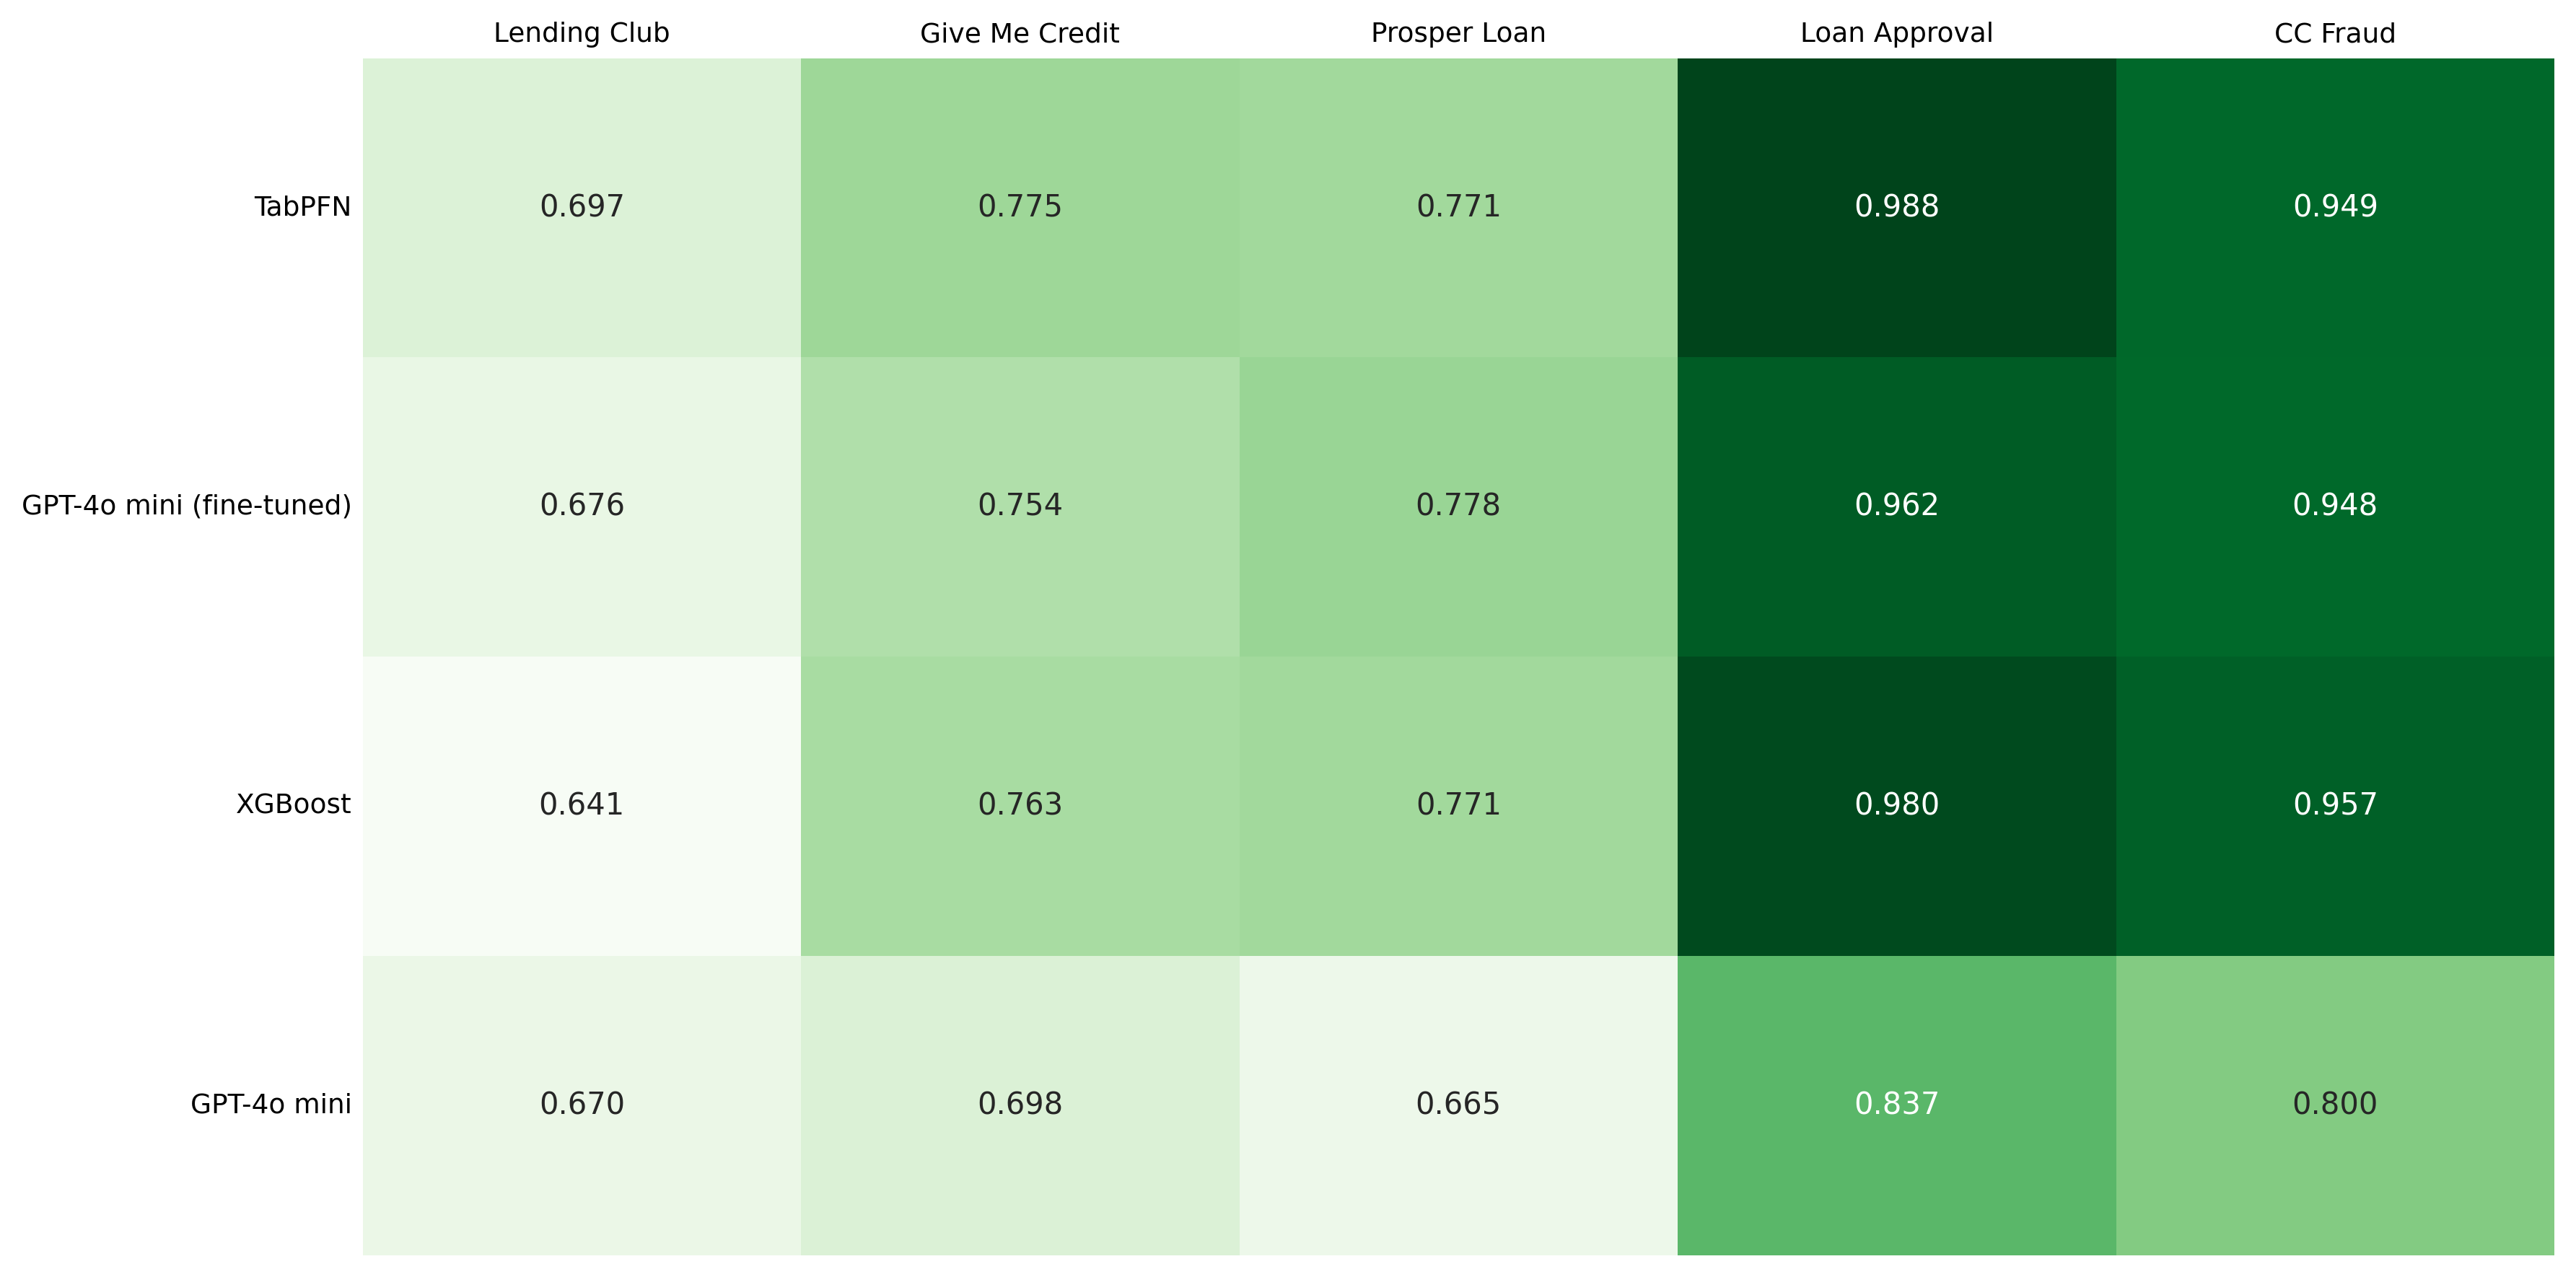
Figure 2: Classification results per dataset
Fine-Tuning Effect
Fine-tuning GPT-4o-mini lifted its classification score from 0.724 to 0.806-an 11% jump that confirms general-purpose models can sharpen their financial intuition with domain-specific data. This improvement demonstrates that the Fine-tuning Factor is an effective tool for bridging the adaptability gap.
However, there is a clear performance ceiling: even after targeted optimization, the fine-tuned general-purpose model still operates within a specific performance bracket. It continues to lag behind TabPFN (0.819), which maintains its lead zero-shot through an architecture specifically designed for the high-stakes, grid-based logic of the funding domain.
The takeaway is that fine-tuning narrows the gap, but does not close it-how a model is built still matters more than how it is trained.
Regression Leaderboard
Regression is the ultimate test of magnitude. It asks the model to predict a specific value, such as a mortgage interest rate or a credit amount. This is where the Math Problem-the difficulty LLMs face when treating numbers as text-becomes a massive hurdle.
| Model Name | Weighted Benchmark Score (WBS) |
|---|---|
| TimesFM | 0.999 |
| TabPFN | 0.777 |
| XGBoost | 0.627 |
| GPT-4o-mini fine-tuned | 0.284 |
| GPT-4o-mini | 0.0 |
Table 3: Regression results.
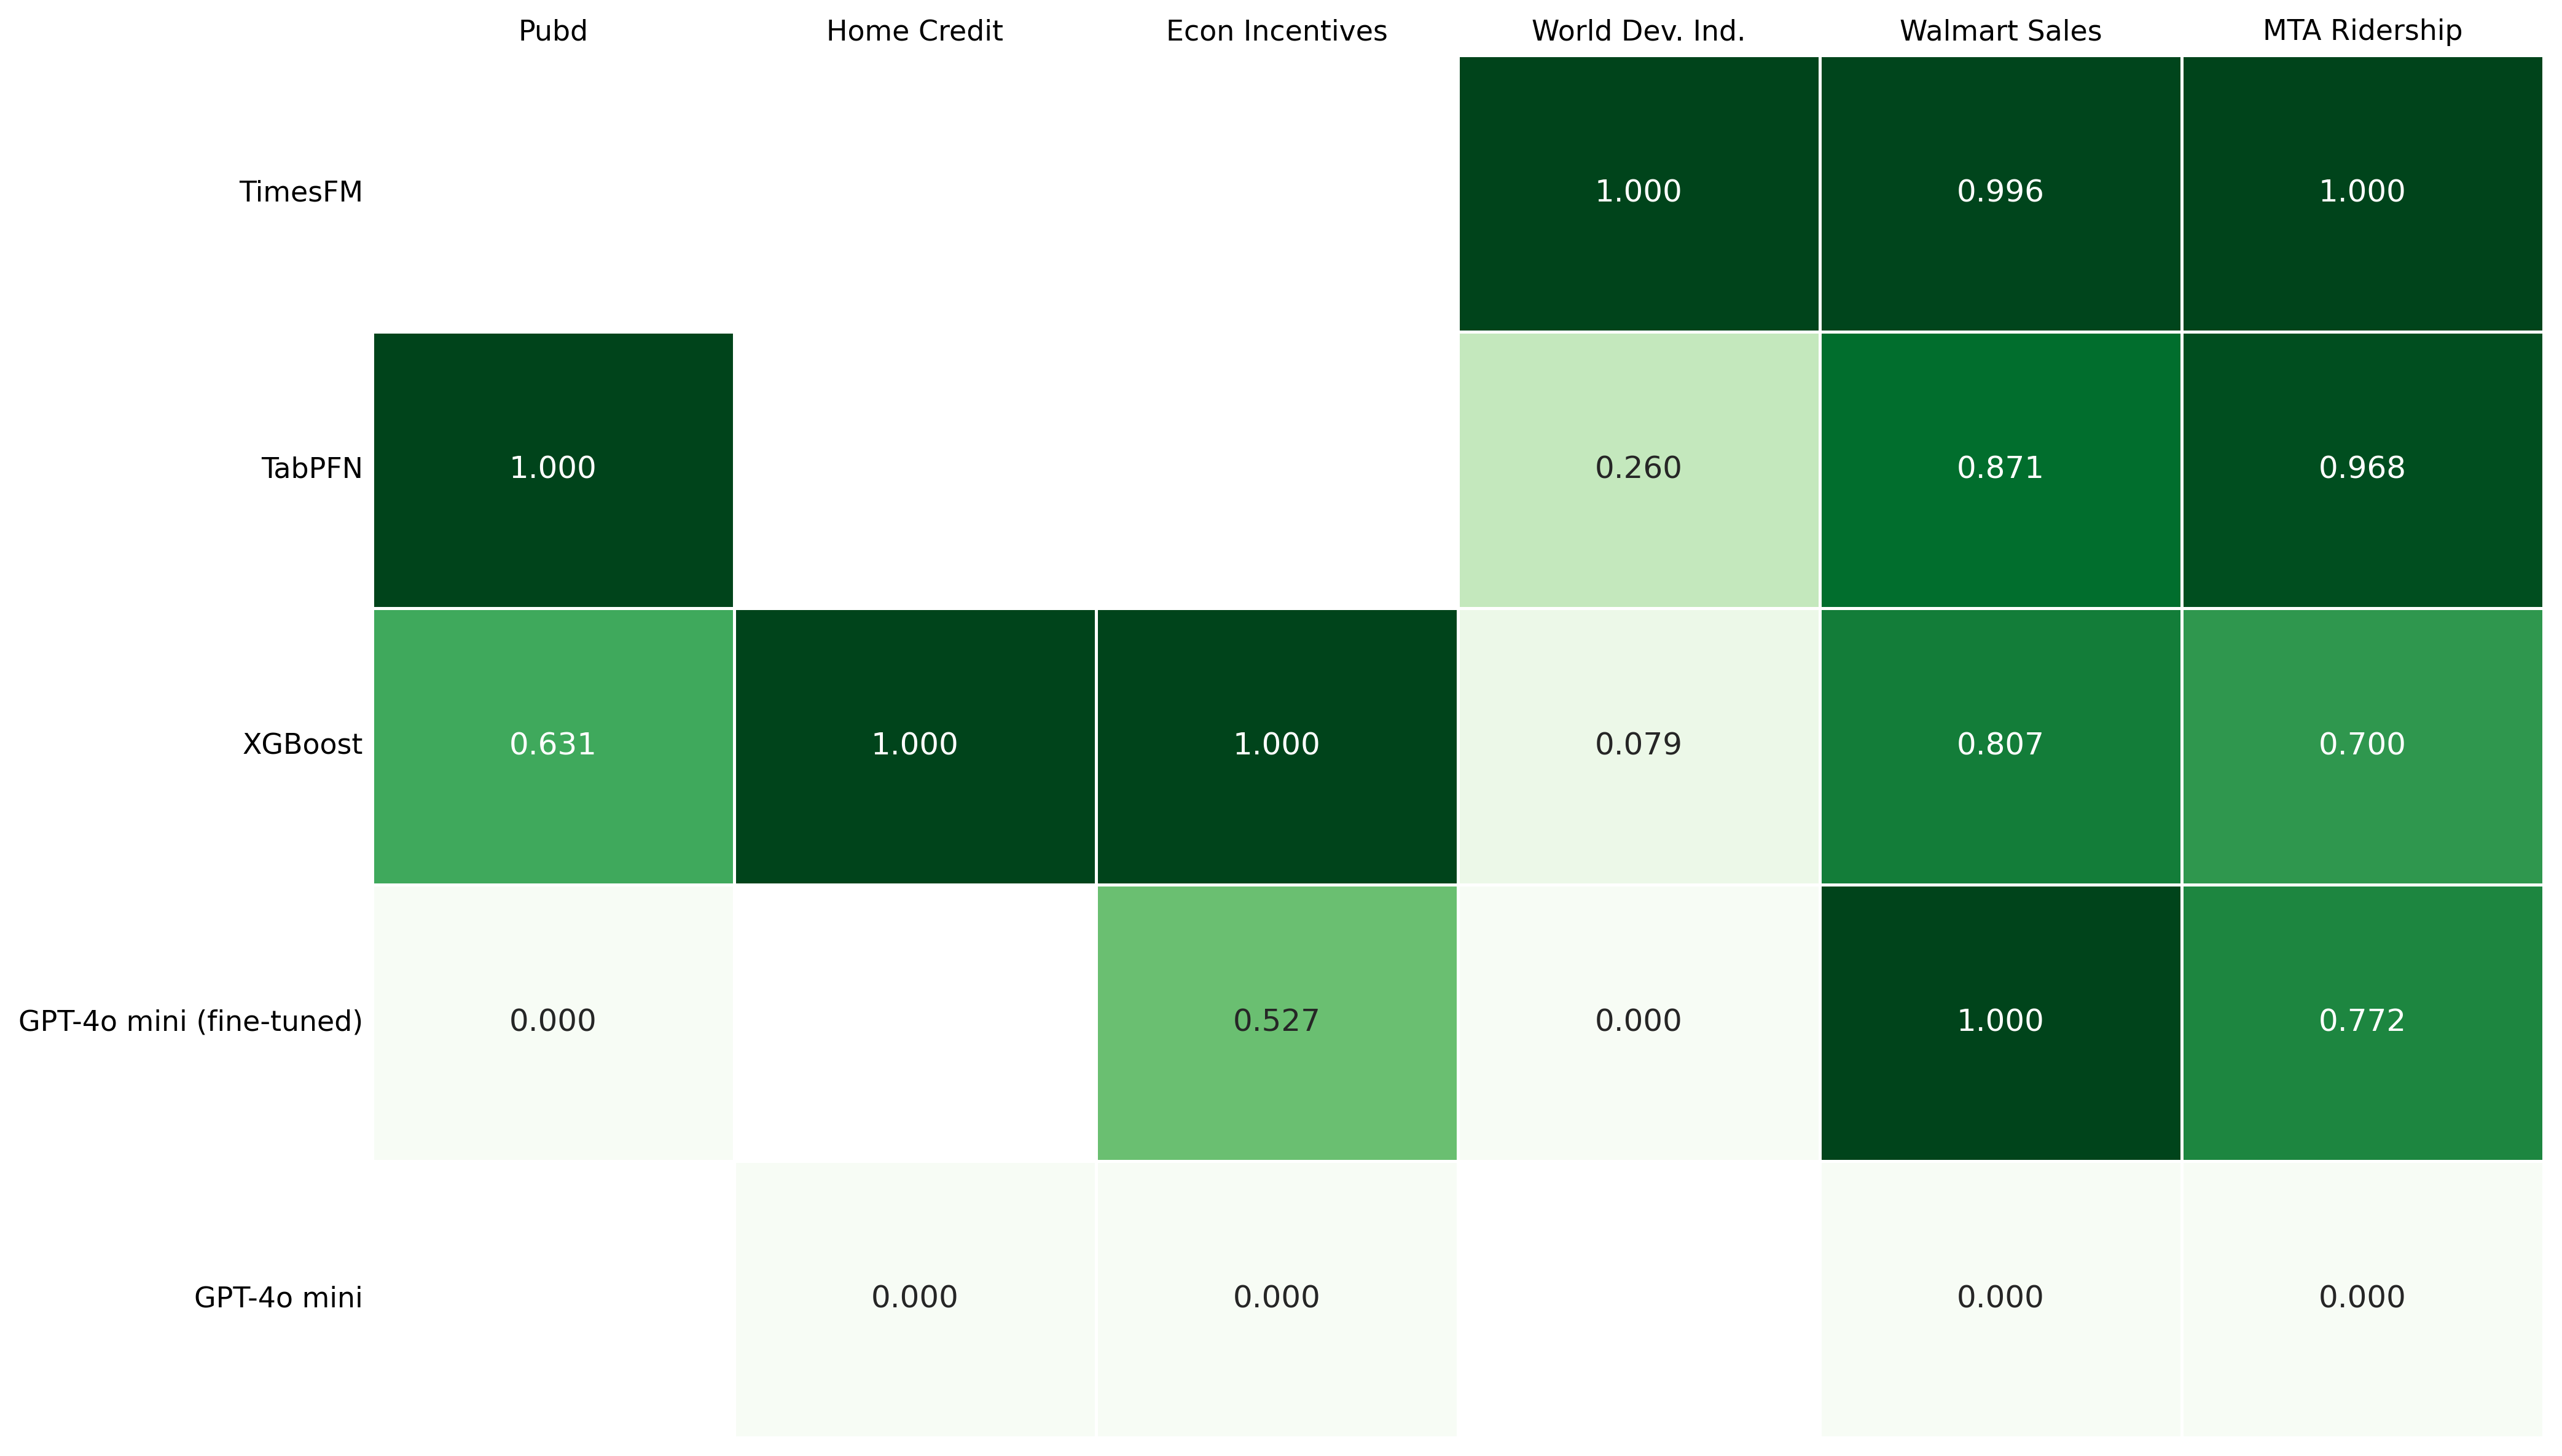
Figure 3: Regression results per dataset
Explaining the Performance Gap
The regression results highlight a performance gap between general LLMs and specialized models. Several factors likely contribute to this:
- The Math Problem (Tokenization): Standard language models process numbers as fragmented text tokens (like "12" and "50" instead of "1250"). This fragmentation can hinder the model's ability to understand mathematical magnitude or perform reliable arithmetic.
- Symbolic vs. Semantic Processing: Specialists like TabPFN are symbolic models designed to treat numerical inputs as actual mathematical values. In contrast, LLMs rely on semantic reasoning, which may be less precise for continuous numerical targets.
- The Temporal Advantage of Time-Series FMs: TimesFM reached the top spot by excelling at datasets with strong temporal dynamics, such as WDI or MTA Ridership. These models use specialized patch processing to understand the trajectory and volatility. However, it is worth noting that while these specialists are world-class on time-series data, they are not universal; their reach is limited to datasets with explicit time-dependent features, whereas TabPFN or LLMs can handle the broader generic tabular data that populates much of the funding landscape.
- Architectural Constraints: Standard sequential LLMs can sometimes struggle with the grid structure of financial data, potentially losing row-column relationships that tabular-focused models like TabPFN are built to preserve.
ROI and Operational Tradeoffs
While the leaderboard measures raw performance, a true Return on Investment (ROI) must also account for the input effort. A model that wins on accuracy may lose on operational viability if it is too cumbersome to deploy.
- General-Purpose Models (Low Effort): Models like GPT-4o-mini offer a plug-and-play experience. Because they are accessed via API, they require zero infrastructure management, allowing for rapid prototyping with minimal technical overhead.
- Cross-Domain Methodological Models (Moderate Effort): Models like TabPFN and TimesFM require a more significant investment. They often demand local hosting, specialized GPU environments, and custom engineering to handle dataset constraints, such as TabPFN's sample limits, which adds a layer of maintenance and architectural complexity.
- The Fine-Tuning Factor (High One-Time Effort): Fine-tuning a polymath to become a vertical expert requires high-quality data curation and compute resources. While it is a one-time investment, it necessitates a deeper level of domain engineering compared to using a zero-shot generalist.
Conclusion
After putting our models through the fair fight of the experimental arena, the results have painted a clear picture of the current state of AI models that might be used for financial tasks. We have moved from theoretical taxonomies to a hard-coded leaderboard, and the data tells a story of two very different paths to intelligence.
Winners and Losers
- The Symbolic Specialist (TabPFN): It is the undisputed champion of the "Efficiency Frontier." By treating numbers as mathematical symbols rather than text, they dominated the classification (WBS 0.819) and regression (WBS 0.777) leaderboards without requiring an additional fine-tuning.
- The Adaptive Polymath (GPT-4o-mini): General-purpose LLMs proved to be effective learners. While they started with a performance gap in their zero-shot state, the Fine-tuning Factor delivered a huge intelligence jump in regression tasks. However, even with this targeted optimization, they still struggled to match the specialized, grid-based logic inherent in TabPFN.
- Standard Machine Learning (XGBoost): XGBoost proved that traditional methods are far from obsolete. In many cases, a well-tuned XGBoost model outperformed LLMs, reminding us that sometimes the simplest tool is the most effective for finding signals in a noisy haystack.
Is Specialized AI Worth It?
Our final opinion? Yes, but with a caveat. If your goal is high-precision risk assessment or complex numerical forecasting, the investment in symbolic specialized architectures like TabPFN is undoubtedly worth it. These models provide a level of numerical intuition that general LLMs simply cannot match out of the box.
However, for tasks that require a blend of semantic reasoning (understanding context) and symbolic reasoning (performing computations), the best path is not about choosing one over the other-it is about integration.
What's Next
The results of this benchmark have provided a clear snapshot of how these models perform in a controlled setting. However, a critical question remains: if we were to further optimize these models with tailored preprocessing steps-such as feature selection-would the current leaderboard hold?
In our next post, we will dive deeper and investigate whether a guided model, stripped of informational noise (with the help of tailored preprocessing), can close the gap between the general-purpose and cross-domain methodological models.